
Module user guide
Cancer treatment follow-up
Practical guide to recording treatment side effects every day and seeing how they change across cycles.
Purpose
This module helps you easily record the side effects of a cancer treatment (for example, chemotherapy), scoring each effect from 0 to 5.
Each level has its definition alongside, so the score is as objective as possible. This makes patterns within each cycle visible so you can discuss them with your medical team.
In this guide
1How to make a record
Today’s effects
Tap Today’s effects to open the daily sheet: all active effects appear, grouped (digestive, skin, mucous membranes, mind and body…). For each effect choose a level from 0 to 5 by reading the definition of each level.
The card shows how many effects you scored that day and the highest value.
If an effect did not bother you, choose level 0: that way it is recorded that you checked it.

Treatment cycle
Record the Cycle number on the day each cycle starts (for example, the infusion day). Cycles are shown as vertical lines on the charts and help you see on which days after treatment the effects appear.
Incidents and history
With Incident you can log important events (an operation, a hospital stay, a fever…) with a label, a severity and a note. You can mark it as resolved when the episode ends.
The history shows all records by day; tap one to edit or delete it.
2Settings
Visible effects
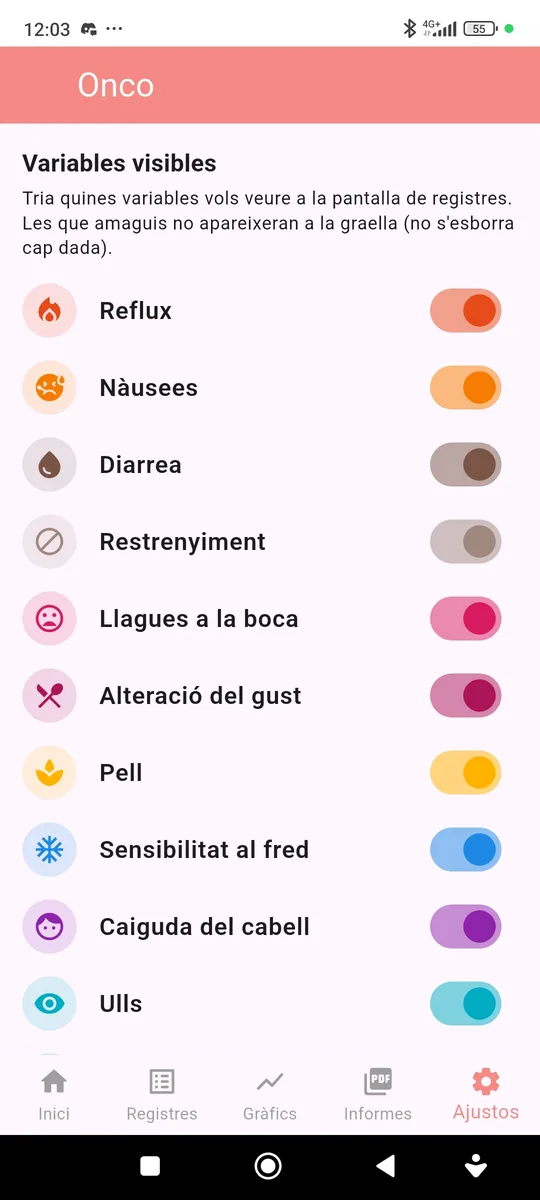
In Settings you can turn each effect on or off according to your treatment. Hiding an effect does not delete any data.
Some common effects (vomiting, tingling or numbness, hand-foot syndrome, bleeding) are off by default; turn them on if you need them.
3Charts
How each effect changes
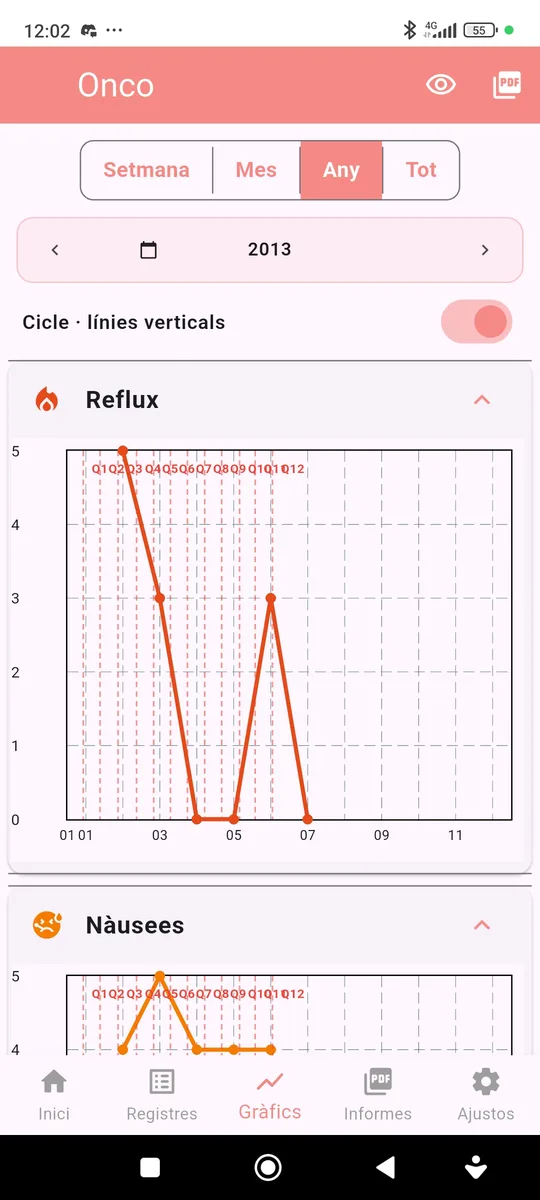
Each effect has its own 0–5 chart. You can choose the period (week, month, year or all) and turn on the cycle vertical lines to see how things change within each cycle. Use the PDF icon to export the charts.
4Reports
Summary and effects matrix
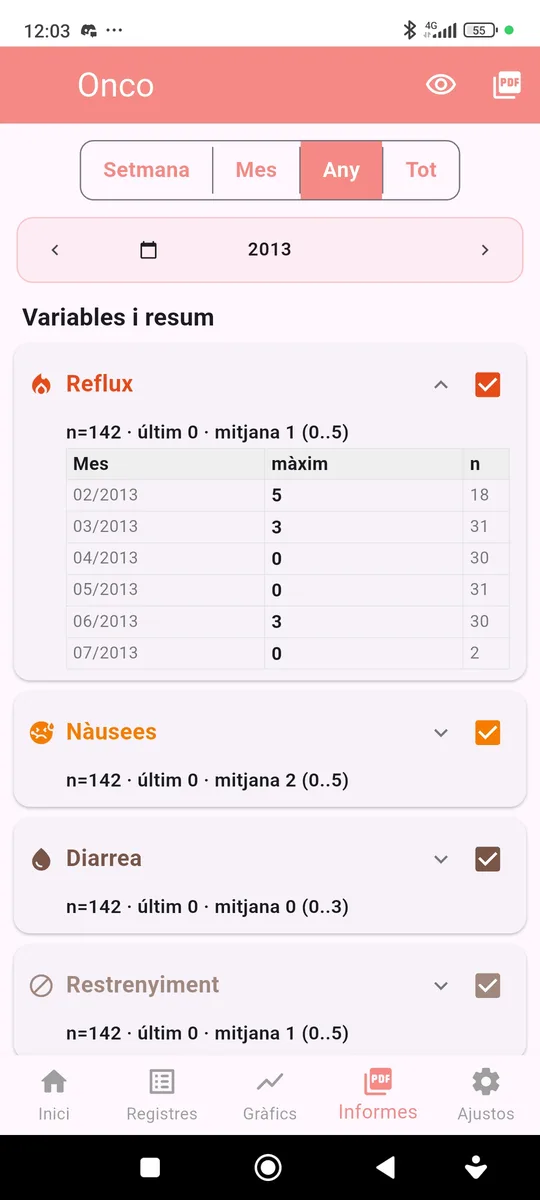
The report shows, for each effect, the number of records, the latest value and the average, plus a table with the highest value by month or by day.
The PDF includes a days × effects table that shows at a glance when each effect appears within the cycle.