
Module user guide
Vital signs
Practical guide to recording weight, temperature, blood pressure and glucose, logging incidents and reviewing how they change.
What can you record?
- Weight
- Temperature
- Blood pressure
- Glucose
- Incidents
With Incident you can keep track of episodes that come and go, such as a migraine or dizziness: see “Incidents and episodes”. If you have entered your height in the general settings, the app calculates your BMI from your latest weight.
In this guide
1How to make a record
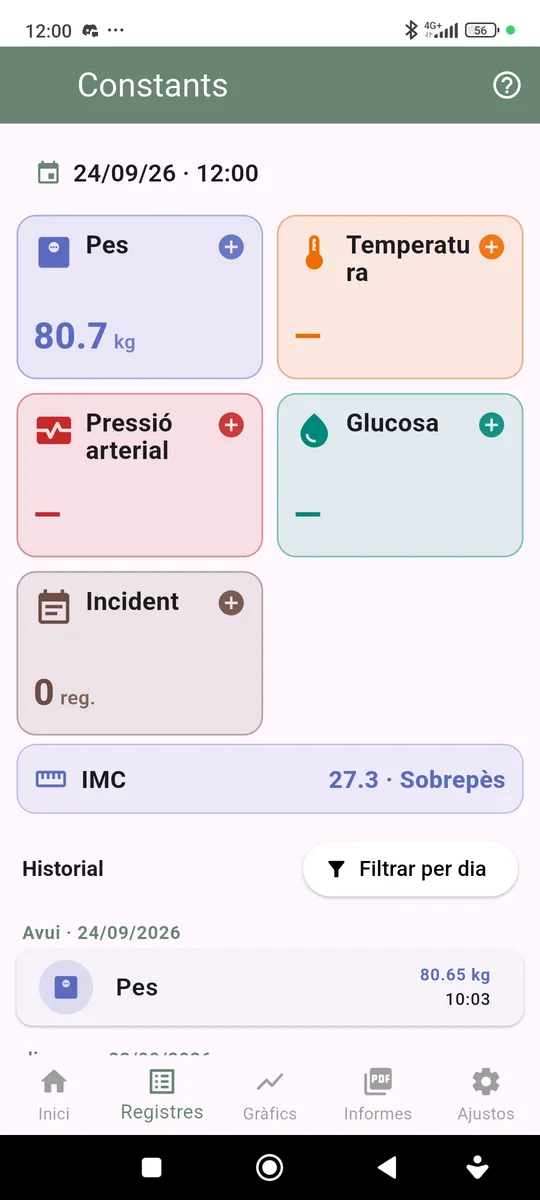
Tap the measurement card
Each measurement has its own card. Tap the card (or the + sign) to open the entry form. The − and + buttons adjust the value, or you can type it directly.
The record date and time are shown at the top. You can change them to add past measurements; a second tap returns to the current time.
Blood pressure: block of readings
Blood pressure can be recorded as a block of several readings (3 by default), with a waiting time between readings and an alert sound when the next one is due. Each reading includes systolic, diastolic and pulse.
If you leave halfway, the app offers to resume the block.
Follow your healthcare professional’s advice on how and when to measure your blood pressure.
History
Below the cards is the history, grouped by day. Tap a record to edit or delete it. With Filter by day you can see only one day’s records.
2Incidents and episodes
Log an incident
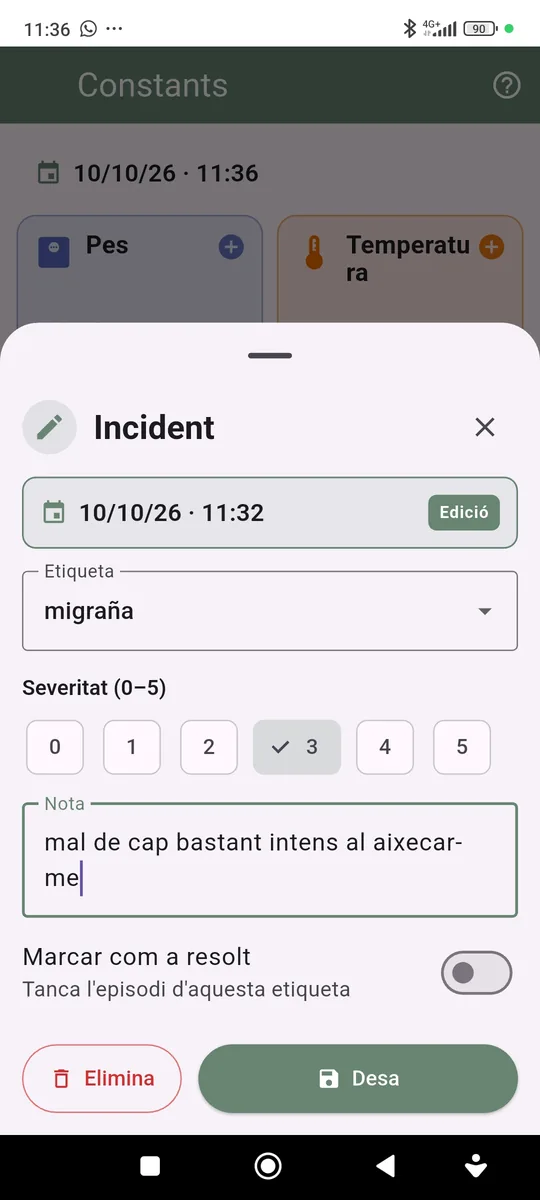
With Incident you can log anything you want to keep track of: a migraine, a flare-up of hives, dizziness, a fever, an occasional pain…
Each entry has a label (pick one you have already used or create a new one), a severity from 0 to 5, which is optional, and a note.
Always use the same label for the same problem: that is what lets the app group your entries.
From incident to episode
Entries with the same label form an episode, shown as ongoing while you keep logging it.
When it is over, mark it as resolved: when you make the last entry or from the history. If more than three days go by with no entry for that label, the next one starts a new episode.
Episodes in the report
The report includes a section with the episodes in the period, which also appears in the PDF. It helps you tell your healthcare team what happened and when.
3Settings
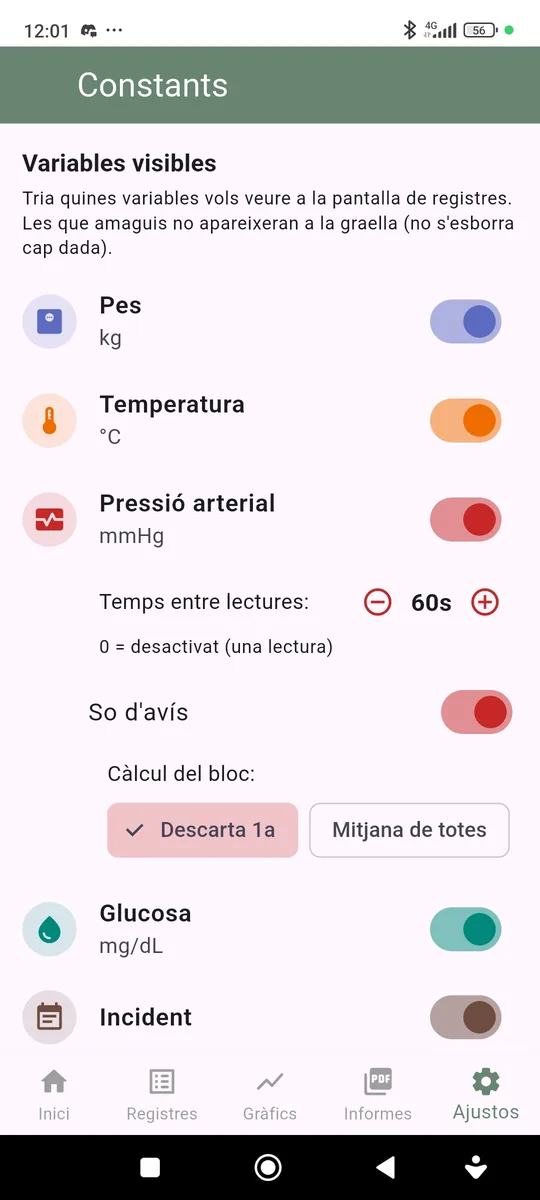
Visible variables and blood pressure
In Settings you can choose which variables appear on the records screen. Hiding a variable does not delete any data.
For blood pressure you can set the time between readings (0 = a single reading), turn the alert sound on or off and choose how the block is calculated: discard the 1st reading or average of all.
4Charts
How each variable changes
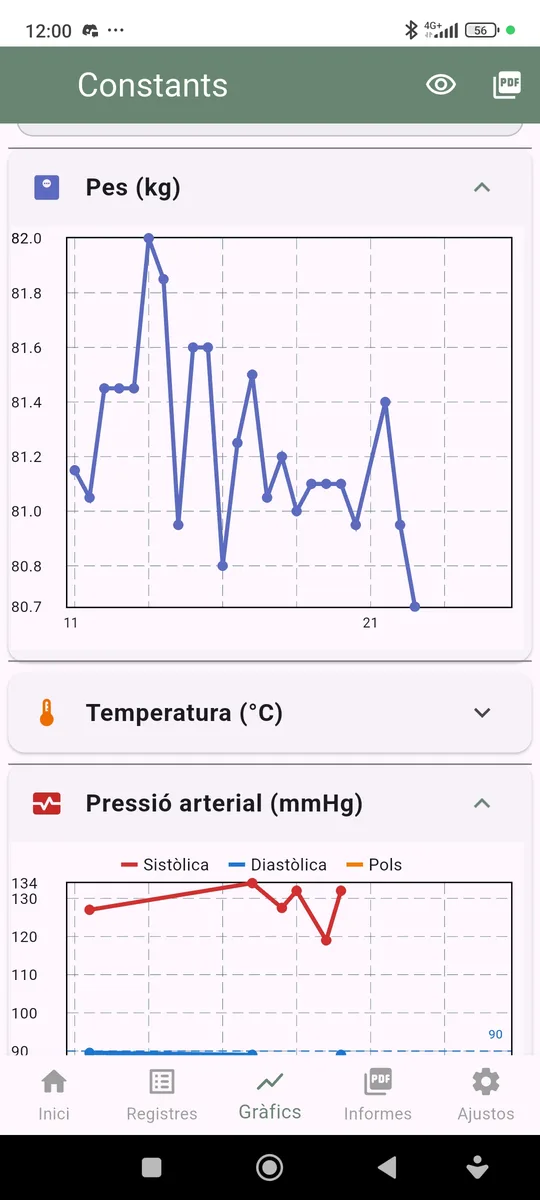
Each variable has its own chart, which you can collapse or expand. Blood pressure shows systolic, diastolic and pulse together. You can choose the period and, with the header icons, preview or export the charts as PDF.
5Reports
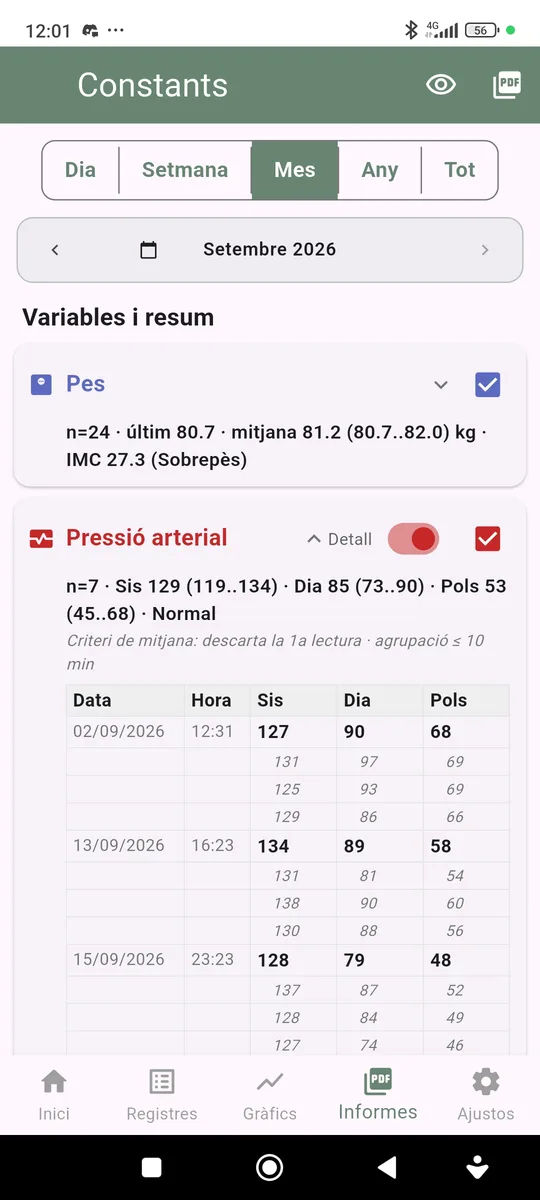
Summary by period
Choose the period (day, week, month, year or all) and move with the arrows. Each variable shows a summary: number of records, latest value, average and range.
Tick the variables you want to include in the PDF. For blood pressure, the Detail switch shows every reading in each block.
Export the report as PDF or CSV with the header icon to share it with your healthcare team.